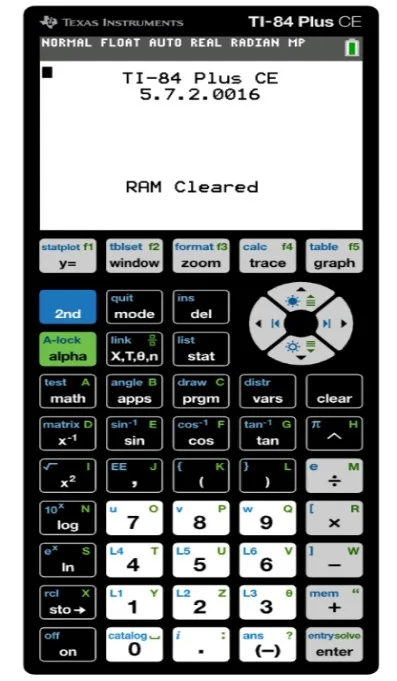
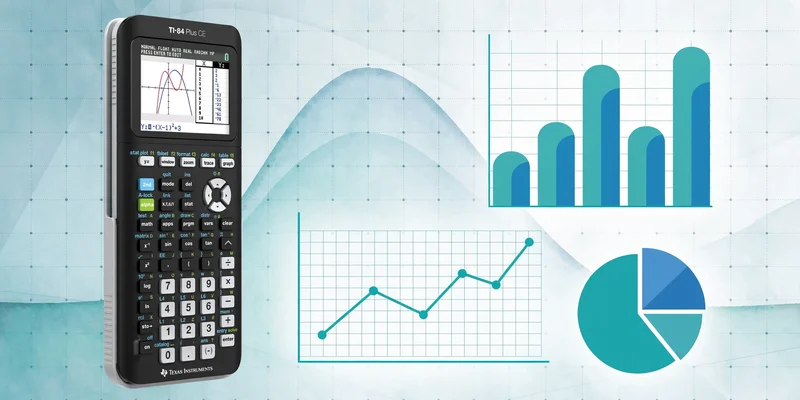

Statistics can be simplified using the best graphing calculator. The functions include analyzing data, statistics, regression, and graphs. You can also use a TI 84 calculator online using your browser. The guide covers the most common statistical operations and helps you learn how to use the calculator.
The TI-84 calculator speeds up calculations significantly due to its STAT menu, which lets you enter data and pull results instantly. With the TI-84, you can calculate the mean, standard deviation, and regression of the data set, and even create scatter plots, histograms, and box plots.
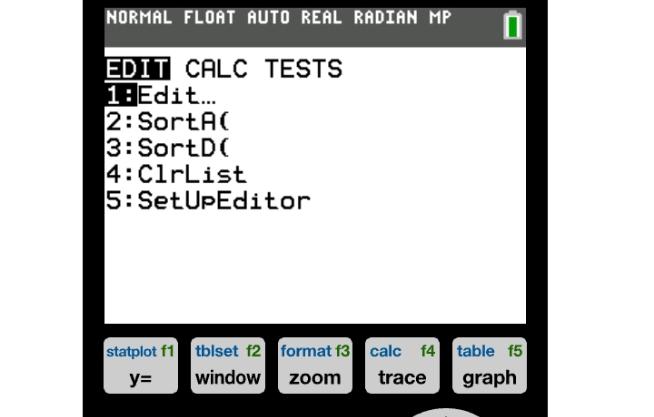
The calculator has many features for different kinds of statistical calculations.
Feature | Purpose | Common Use |
1-Var Stats | Find basic statistics | Mean and standard deviation |
2-Var Stats | Analyze two variables | Paired data |
Regression | Create models | Predictions |
Scatter Plot | Displays paired values | Finding relationships |
Histogram | Shows frequency | Studying distributions |
Box Plot | Shows data spread | Comparing data |
These features allow you to study numerical data from different angles.
Press STAT and select the option to edit. Input the first data set into L 1. You can use L 2 to enter a second set of values. Make sure to align the data values accordingly if you are adding two different sets. Double-check all of your numbers before you finalize your calculations.
The same procedure applies on our TI-84 calculator online, so you can practice this exact workflow directly in your browser.
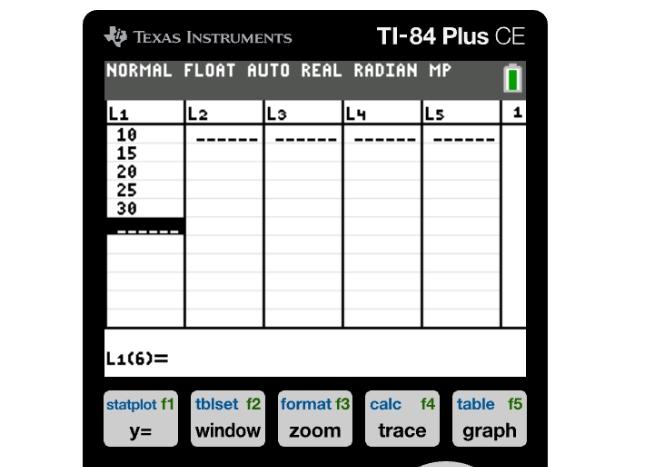
The mean is the average of the numbers in your data set. First, you have to input your data into L1.
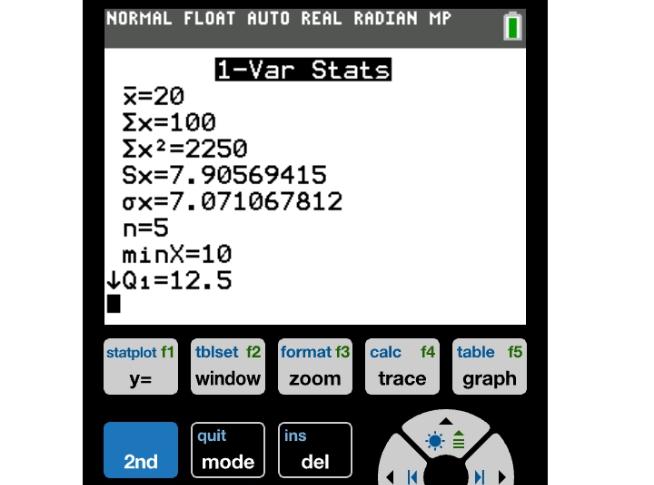
Next, go to STAT, then the CALC menu, and select 1-Var Stats. You'll see List, FreqList, and Calculate fields; keep L1 as the list, leave FreqList blank, and select Calculate, then press ENTER. After that, you will see a list of values on the screen, and you want to look for x̄. That is your mean.
Standard deviation is a measure of how much the values in a set vary. The TI-84 has two standard deviation calculations, one for a sample and one for a population. Enter your data to begin. Go to STAT, then CALC, and select 1-Var Stats. Select the list where you entered the data and press ENTER.
The result will show Sx for the sample standard deviation and σx for the population standard deviation. You now need to decide which one you actually need.
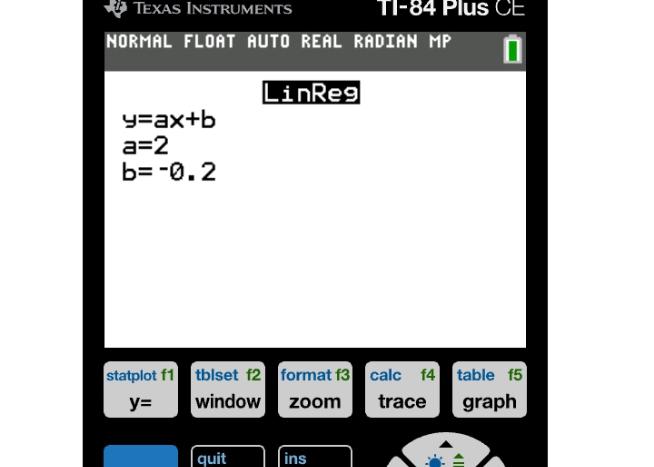
Regression is used to determine the relationship between two sets of data. The x-values are entered in L1, and the y-values are entered in L2. Go to STAT and then go to the CALC menu. For linear regression, select LinReg(ax + b). The TI-84 will display the regression equation for the data.
With the regression equation, one can predict values. The TI-84 also supports other regression types beyond linear, including quadratic, exponential, and power; all available under STAT → CALC.
A scatter plot is a graph that shows how two different pieces of numerical data relate to each other. First, you need to type in your x-values into L1 and your y-values into L2. Next, press STAT PLOT and turn on Plot1. Make sure that your type of plot is a scatter plot, and press Enter. Then, set your Xlist to L1, and your Ylist to L2.
Finally, press ZOOM, and then select ZoomStat. Your graphing calculator should now show you your scatter plot.
The accuracy of data entry is important for statistical results. Let’s go over some statistical tips and rules of thumb from above:
You can also try a graphing TI-84 calculator online to help with your statistical calculations.
The Texas Instruments TI-84 is an extremely useful device in terms of statistics and data analysis.
It can be used for finding the mean or standard deviation, regression analysis, and graphing out distributions, scatterplots, and many more.
In addition, once the person is familiar with the calculator, all these features can come with ease.
Yes, you can calculate the mean on a TI-84 calculator by going to the STAT menu, then CALC, and choosing 1-Var Stats.
TI-84 calculators have an option to calculate sample and population standard deviation. To calculate standard deviation, you have to enter your data and then go to 1-Var Stats.
Regression is available on TI-84 calculators. There are various types of regression other than linear.
Yes. The online version works the same as the physical calculator, with no download required.
A TI-84 calculator is a graphing calculator with statistical functions.
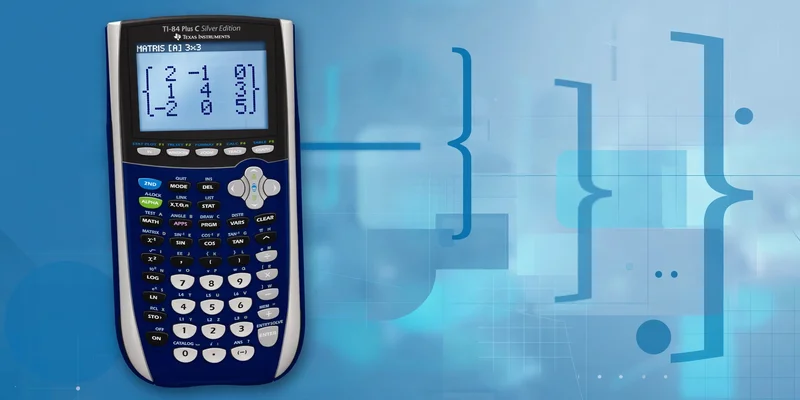
Matrices are essential in algebra, linear equations, and higher-level mathematics. Fortunately, a TI-84 calculator can perform a wide range of matrix opera...
TI-84 Calculator Online, along with the TI-83 Plus, TI-89 CAS graphing calculator, online graphing calculator and TI-30XS scientific calculator, provides students with versatile digital tools for solving equations, plotting graphs, and handling complex math problems. These calculators can be used directly in any browser without installation, making them perfect for math and science students looking for quick and easy solutions.


© 2026 — Revision. All Rights Reserved.