
Linear regression is useful when you want to see how two sets of data are connected. Doing the calculations by hand can take time. But with the TI-84 calculator, you can find the regression equation in just a few steps. It's one of the most widely used graphing calculators for statistics.
\nIn this guide, you will learn how to enter data, find the regression equation, understand the results, and graph the line.
\nLinear regression finds the best straight line for a set of data points. This equation is usually written in the form y = ax + b. Here, 'a' represents the slope, while 'b' represents the y-intercept. The calculator finds these two values from the data that you have provided.
\nA graphing calculator is particularly useful because it lets you calculate the equation and view the data on a graph.
\nThe process is quite straightforward once your data is ready. You just need to enter the numbers correctly and choose the calculation type from the STAT menu.
\nFirst, enter your x-values and y-values into separate lists. For example, suppose you have the following values.
\n\n
|
\n X Values \n |
\n
\n Y Values \n |
\n
|
\n 1 \n |
\n
\n 3 \n |
\n
|
\n 2 \n |
\n
\n 5 \n |
\n
|
\n 3 \n |
\n
\n 7 \n |
\n
|
\n 4 \n |
\n
\n 9 \n |
\n
|
\n 5 \n |
\n
\n 11 \n |
\n
\n
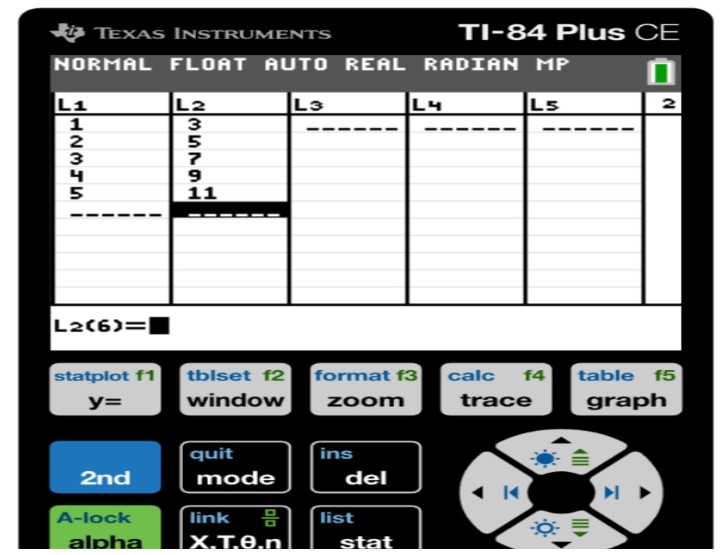
Now, press STAT on your calculator and highlight 1:Edit. Then, press Enter. You should see columns with L1, L2, and L3 on the top. You need to put in your x-values (independent variable) in L1 and your y-values (dependent variable) in L2. Make sure that you match them, so your regression equation will be accurate.
\nAfter entering your data, calculating the regression equation is simple. Press STAT, and use the arrow keys to open the CALC menu. Select LinReg(ax+b) and press ENTER. This pastes the command onto your home screen; you'll then need to type in which lists to use. Since our data is in L1 and L2, type L1,L2 after the command, so it reads LinReg(ax+b) L1,L2, then press ENTER. The calculator will display several numbers on the screen.
\nTip: If you also add ,Y1 at the end (LinReg(ax+b) L1,L2,Y1 — insert Y1 via VARS → Y-VARS → Function → Y1), the calculator automatically stores the equation into Y1, so you won't need to retype it when graphing.
\nNote: If your screen also shows r and r² values, that means Diagnostics is turned on. If you don't see them, enable this under 2nd → 0 (CATALOG) → DiagnosticOn.
\nNow look at the values appearing for a and b. For the example above, the calculator gives these results:
\na = 2
\nb = 1
\nEnter these values into the regression formula:
\ny = ax + b
\nThis gives us the equation:
\ny = 2x + 1. The number 2 is the slope.
\nThis means that y increases by two whenever x increases by one. The number 1 is the y-intercept. This indicates where the line intersects the y-axis. With the TI-84, it becomes easier to get these values without having to do many calculations yourself.
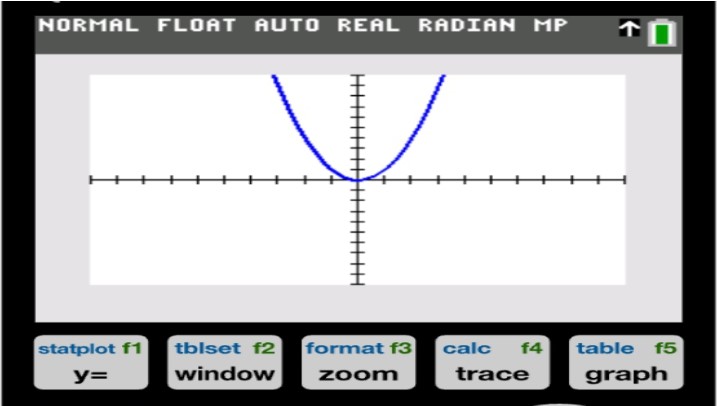
\nIn addition, you can also display your data points and the regression line on the calculator. To do this, press 2nd and then the Y= to access the plot settings. Select Plot1 and turn it ON. Select the scatter plot option. Set the Xlist to L1 and the Ylist to L2.
\nThen, enter the regression equation you found in Step 3 on the Y= screen (or skip this if you already stored it to Y1 in Step 2). Once you do this, hit GRAPH to view the data points and the line of best fit. The plot makes it much easier to analyze whether the data points form a linear pattern.
\nSuppose a student tracks weekly exercise hours and resting heart rate:
\n|
\n Hours Exercising \n |
\n
\n Resting Heart Rate (bpm) \n |
\n
|
\n 1 \n |
\n
\n 78 \n |
\n
|
\n 2 \n |
\n
\n 74 \n |
\n
|
\n 3 \n |
\n
\n 70 \n |
\n
|
\n 4 \n |
\n
\n 66 \n |
\n
|
\n 5 \n |
\n
\n 62 \n |
\n
Enter exercise hours in L1 and resting heart rate in L2, then run STAT → CALC → LinReg(ax+b) L1,L2.
\nYou get:
a = -4
b = 82
The regression equation is y = -4x + 82. In this example, resting heart rate drops by about 4 bpm for every additional hour of weekly exercise.
\nBefore you use your equation, make sure you double-check the data you entered. Make sure all of your x-values have the correct y-values and that both columns contain the same number of values. If something looks wrong, go to STAT, then EDIT, and review your data.
\nIf you don't have a physical calculator on hand, you can run through this entire process using our free online TI-84 calculator. Just type in the same functions directly on the site, and it will calculate and display your regression equation the same way a physical TI-84 would. No need to install anything or have the device with you.
\nLinear regression on a TI-84 calculator is straightforward, but one needs to know where to find the necessary tools. It is critical to enter data correctly and hit the button “LinReg(ax+b).” After pressing this key, you will be offered the option to view the results on the screen, from which you can determine the equation of the line.
\nFrom there, you can graph the line, analyze the relationship in your data, and use the equation to predict future trends with ease.
\nAlso try: these regression steps work the same on the TI-83 Plus calculator online, which has the same STAT menu. For symbolic statistics work, see the TI-89 calculator online.

Learn how to use a TI-84 calculator with this complete beginner's guide covering the interface, calculations, graphing, and essential settings.
What We Are?
TI-84 Calculator Online, along with the TI-83 Plus, TI-89 CAS graphing calculator, online graphing calculator and TI-30XS scientific calculator, provides students with versatile digital tools for solving equations, plotting graphs, and handling complex math problems. These calculators can be used directly in any browser without installation, making them perfect for math and science students looking for quick and easy solutions.


© 2026 — Revision. All Rights Reserved.