
A list of numbers may seem innocuous until a statistics problem asks you to find three different results from it. The mean is familiar, but median and standard deviation can make the calculation much longer by hand.
A graphing calculator makes this easier by handling the calculations together. You enter the data once, run the right statistics function, and the results appear on the screen. The useful part is that you can follow the same process on a physical calculator or practice it online.
For this guide, we'll use a small dataset and calculate its mean, median, and standard deviation from start to finish.
A TI-84 calculator isn't just for graphing parabolas and solving equations. It has a built-in statistics engine that most people don't actually explore. Rather than manually adding up numbers and squaring differences for standard deviation, you can let the ti-84 handle the entire calculation. You can let the TI-84 handle the entire calculation.
Before we begin, open our TI-84 Calculator Online. It gives you the exact interface as a physical ti-84, so you can follow every step directly in your browser window.
We'll be using this data set:
5, 7, 8, 10, 10, 12, 14, 16, 18
There's no need to calculate the three answers separately. The 1-Var Stats function on a ti 84 calculator works out all of them from a single list.
Press STAT and select 1:Edit. A table opens with columns L1, L2, and L3. Use L1 for this example and type each number, then press ENTER.
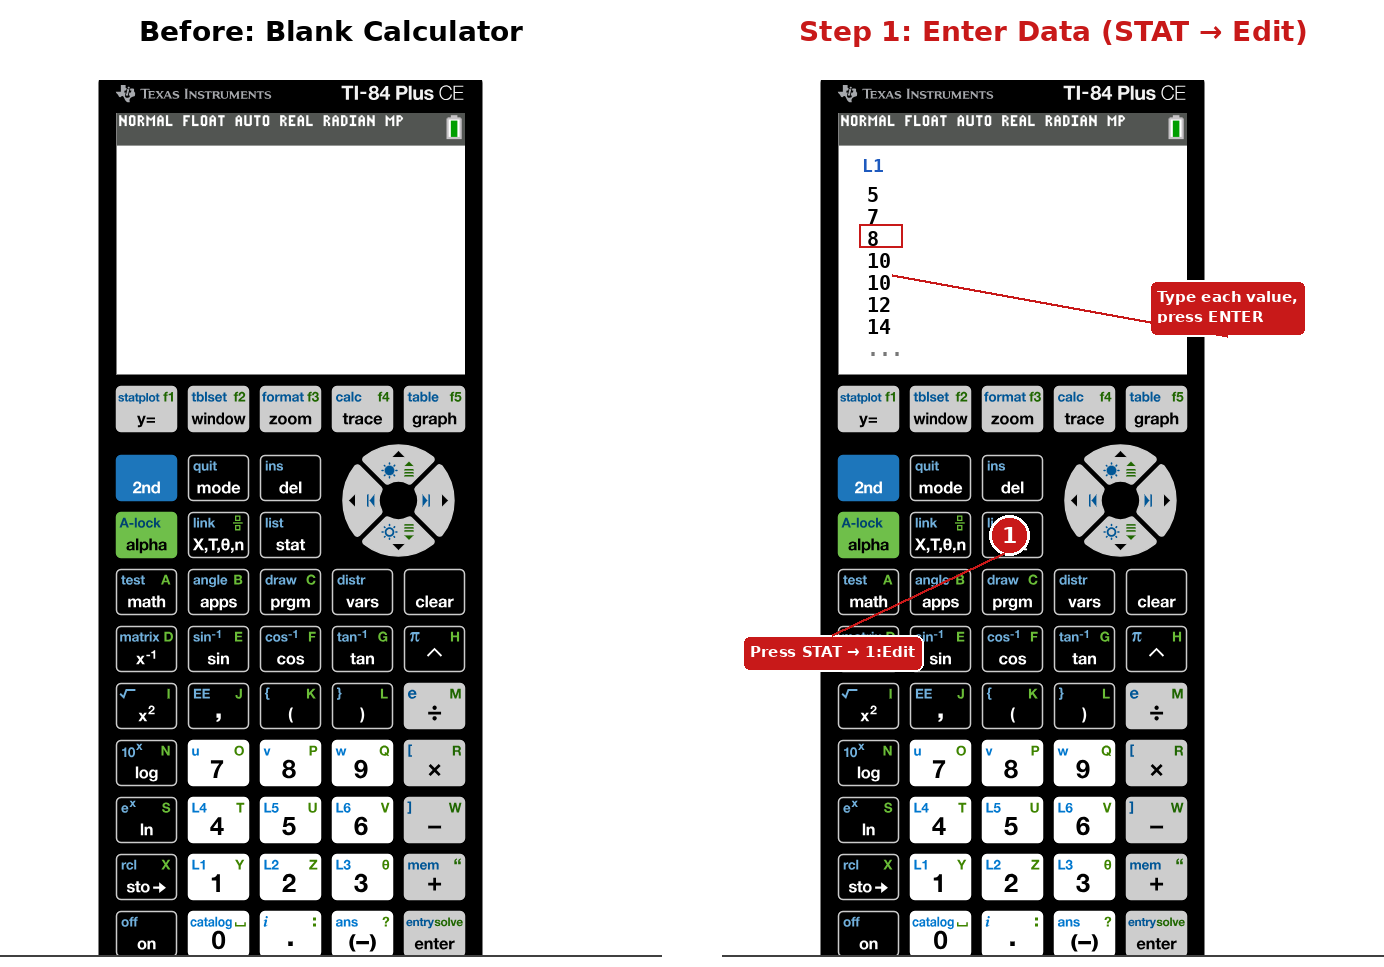
Tip: Tip: If L1 already has old numbers sitting in it, clear them first with STAT → 4:ClrList, then specify L1 and press ENTER. Otherwise old values will mix into your new data.
Here you have to press STAT again, then move over to the CALC tab. Select 1:1-Var Stats and press ENTER.
You'll see three fields: List, FreqList, and Calculate. Keep L1 as the list, leave FreqList blank, and select Calculate.
Press ENTER one more time. Your TI-84 will display the statistical results for the data in L1. Use the down arrow to view additional results, including the median and standard deviation.
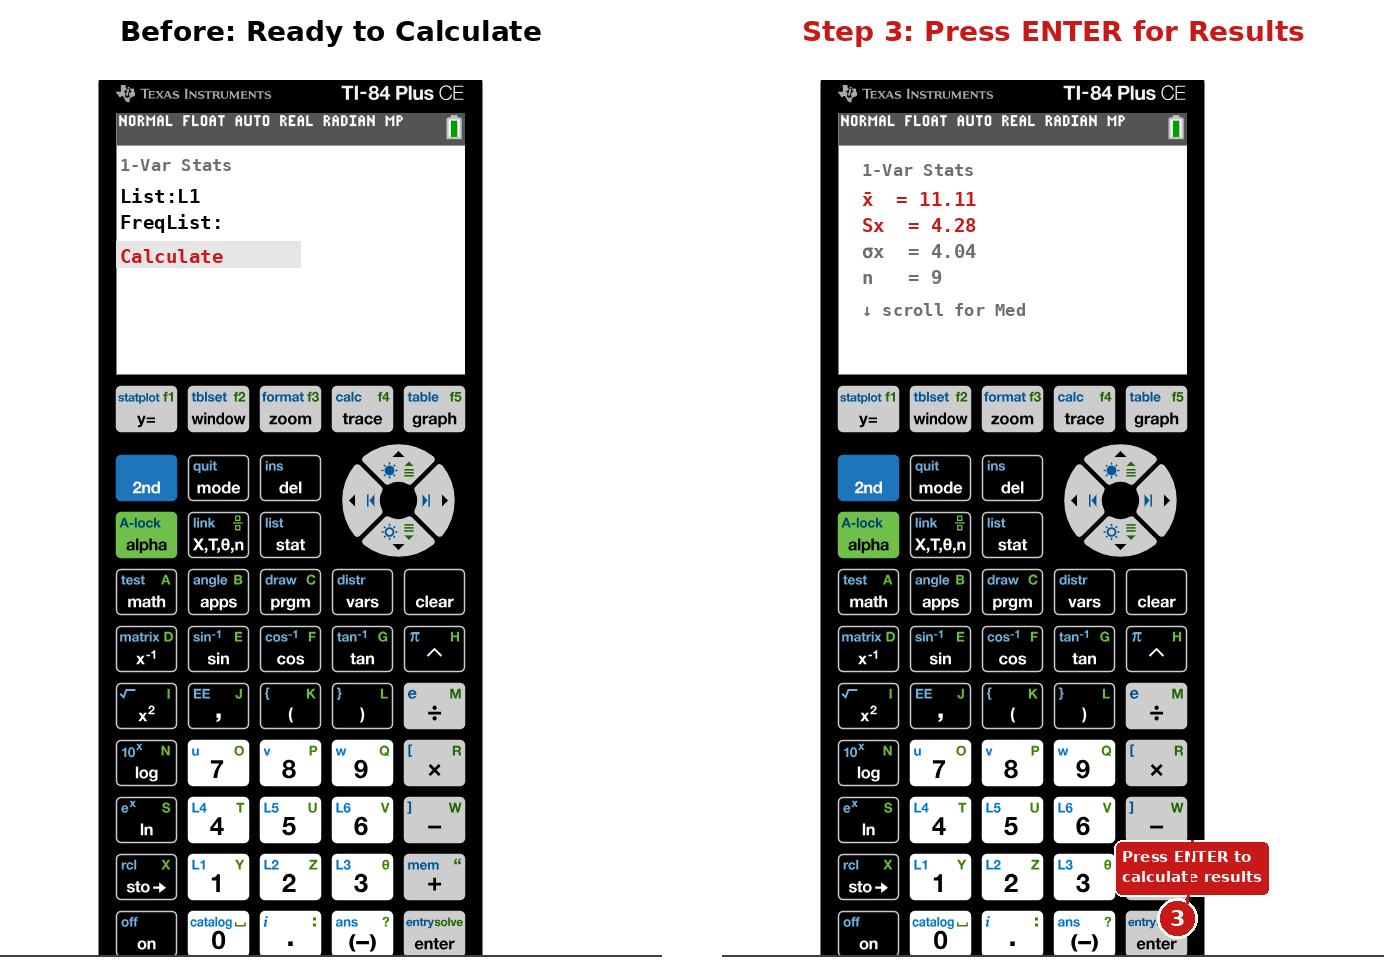
The mean is the average of all the numbers in your data set. On the first results screen, look for x̄, which is the very first value the graphing calculator shows you. For our example, the result is x̄ = 11.11.
You can check this by adding the nine numbers together to get a total of 100, then dividing by 9, which gives approximately 11.11. Doing this by hand isn't hard with nine numbers. However, it gets tedious fast once your data set grows to twenty or thirty values, which is exactly where a ti 84 calculator saves time.
The median can be easy to miss because it appears below the mean in the TI-84 results. After running 1-Var Stats, press the down arrow key to move through the results. You’ll find Med along with minX, Q1, Q3, and maxX.
For our data set, the numbers are already in order:
5, 7, 8, 10, 10, 12, 14, 16, 18
Since there are nine values, the fifth number is the middle value. Therefore, the median is 10, and the ti-84 displays Med = 10.
Standard deviation tells you how spread out your values are around the mean, and it appears on that first results screen along with the mean. This is the part that confuses most students, because the calculator gives you two different values:
For our data, the results are approximately Sx = 4.28 and σx = 4.04.
Which one should you use? That depends on your data, not the calculator. If your numbers are a sample taken from a larger population, use Sx. If your numbers represent the entire population, use σx.
Symbol | Represents |
x̄ | Mean |
Sx | Sample Standard Deviation |
σx | Population Standard Deviation |
Med | Median |
Using a ti 84 calculator makes it much easier to find the mean, median, and standard deviation from a data set. Once your values are entered into L1, the 1-Var Stats function calculates the results together.
You can quickly find x̄ for the mean, Med for the median, and Sx or σx for sample and population standard deviation. This saves time when you are working through statistics problems, especially during timed tests.
The main thing is knowing where each result appears and which standard deviation the question requires. After a few practice runs, the process becomes quick and straightforward — you'll know exactly where to look for each result.
A graphing calculator can do much more than you think. The TI-84 can handle everything from graphing, algebra, and statistics to trigonometry. Students, teacher...
TI-84 Calculator Online, along with the TI-83 Plus, TI-89 CAS graphing calculator, online graphing calculator and TI-30XS scientific calculator, provides students with versatile digital tools for solving equations, plotting graphs, and handling complex math problems. These calculators can be used directly in any browser without installation, making them perfect for math and science students looking for quick and easy solutions.


© 2026 — Revision. All Rights Reserved.